Resources · November 10, 2026
Can Unusual Volume Predict Gaps in Stocks?
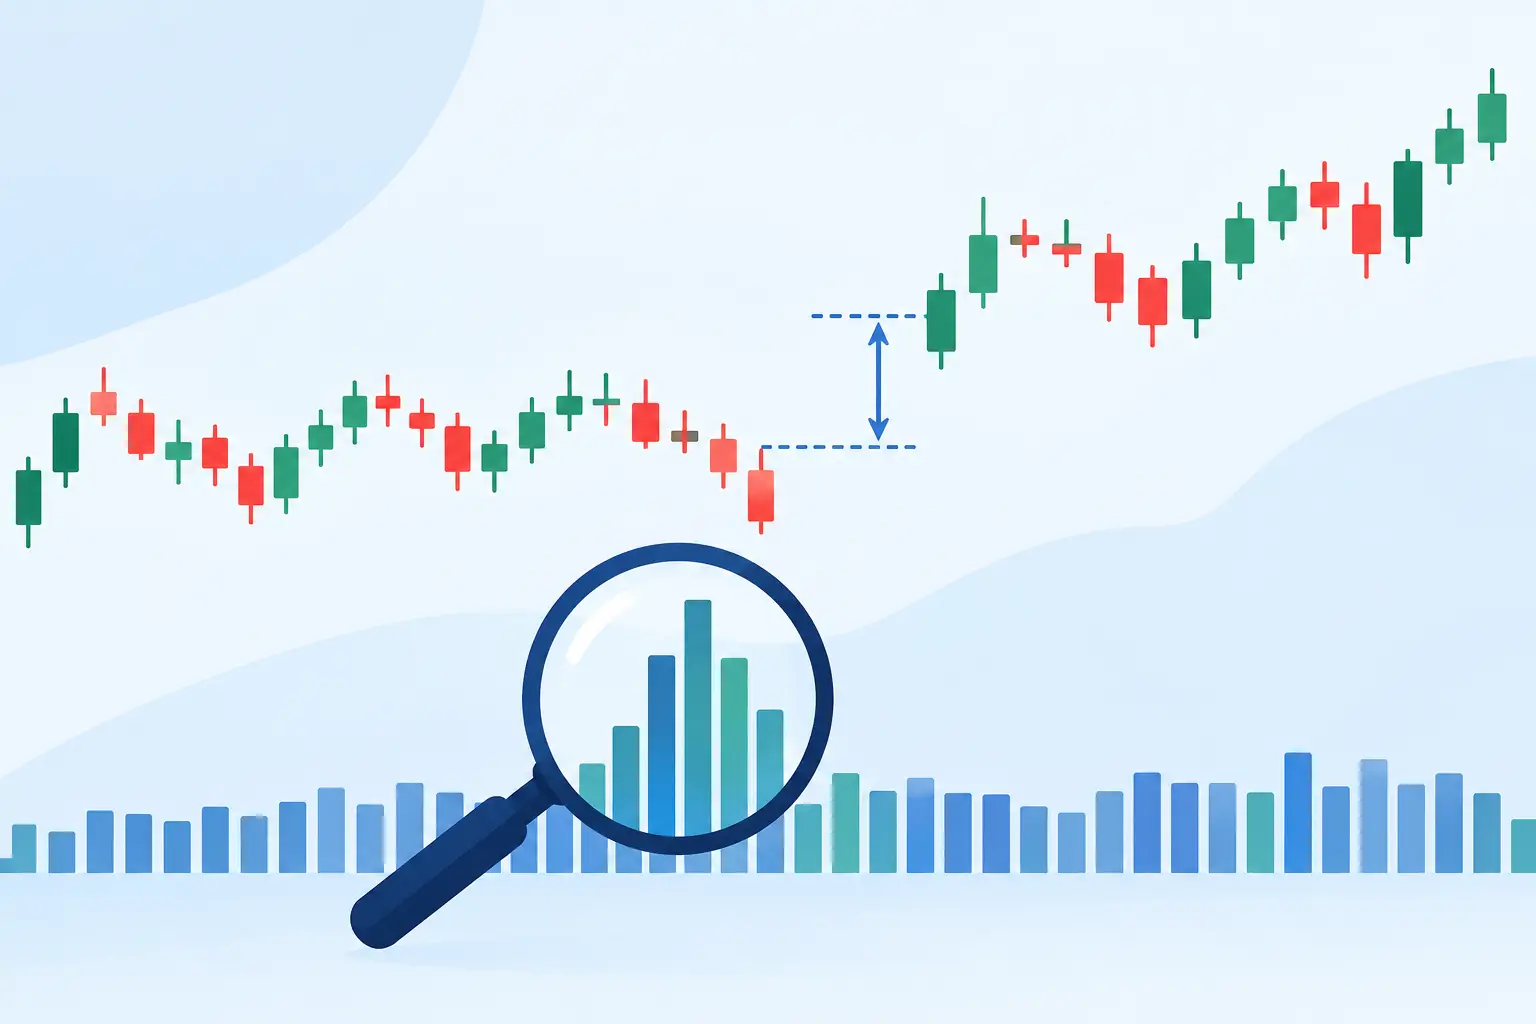
A stock trading three or four times its normal volume shortly before your short put expires deserves attention. But can unusual volume predict gaps? Sometimes it can identify conditions where gap risk is elevated. It cannot tell you with precision whether the next move will be up or down, when it will occur, or whether the market has already priced in the information.
For premium sellers, that distinction matters. The goal is not to turn volume into a directional signal. The goal is to recognize when the apparent edge in a high-IV option may be compensation for an event, a positioning imbalance, or information risk that can overwhelm theta.
What unusual volume is actually telling you
Unusual volume means current activity is materially above a stock's own typical level for a comparable period. A five-million-share day may be routine for one large-cap name and highly unusual for another. Context matters more than an arbitrary share threshold.
Volume reflects participation, not intent. It can rise because institutions are repositioning, index funds are rebalancing, a news item has changed the outlook, or traders are reacting to a rumor. It can also rise for mechanical reasons, including an options-related hedge flow or a widely watched technical level drawing short-term activity.
That is why unusual volume is best viewed as an alert. It tells you that the market is paying unusual attention to a ticker. It does not tell you that a gap is inevitable.
A gap occurs when the market must reprice a security between one tradable price and the next, often after an overnight or intraday information shock. Earnings, regulatory decisions, litigation developments, M&A news, executive changes, guidance revisions, analyst actions, and macro spillover can all create gaps. Volume may appear before, during, or after these events, but its meaning changes in each case.
Can unusual volume predict gaps before they happen?
It can improve a trader's estimate of risk when it appears alongside evidence of a pending catalyst. The key word is alongside. Volume by itself is a weak forecast. Volume paired with compressed timing, elevated implied volatility, abnormal options activity, and an incomplete news explanation is more useful.
Consider a stock that has traded near its 20-day average range for weeks. Two sessions before a known FDA decision, shares trade at 250% of average daily volume, implied volatility rises, and short-dated calls and puts both see heavy demand. That does not establish the decision's outcome. It does establish that the market expects a larger-than-normal repricing risk. Selling a narrow credit spread simply because premium looks attractive may be a poor risk-reward trade.
The same volume spike means something different after earnings. If a company gaps 12% on results and trades huge volume all day, the activity confirms broad participation in the new price discovery process. It may indicate that the gap is meaningful rather than a thin, overnight move. But it is not a clean signal that the gap will fill or continue. Traders who treat high post-gap volume as automatic continuation or automatic exhaustion often learn this the expensive way.
The timing of volume matters
Pre-event volume deserves the closest scrutiny for option sellers. A rise in activity before an earnings release, court ruling, investor day, product launch, or regulatory date can signal that participants are positioning for uncertainty.
Volume that arrives with a clear public headline is easier to interpret but may be less useful as an early warning. By the time the reason is obvious, implied volatility may already reflect much of the risk. The relevant question shifts from “What is happening?” to “Is the remaining premium enough for the distribution of possible outcomes?”
Unexplained volume is often the most dangerous category. It does not prove that someone knows something you do not. It does mean you should not assume the ticker is business as usual. Before selling premium, investigate the event calendar, recent filings, company news, and the option chain rather than relying on a quiet-looking price chart.
Stock volume and options volume answer different questions
Stock volume shows that shares are changing hands. Unusual options volume can reveal where traders are concentrating exposure, especially in near-term expirations. Neither is self-explanatory.
A large call print may be a bullish bet, but it may also be a covered-call sale, a spread leg, a stock replacement position, or a hedge. A large put trade may be bearish speculation, downside protection, or part of a larger volatility structure. Volume without open-interest changes, trade direction, execution context, and strike selection can be misleading.
Still, options activity becomes more relevant when it clusters in contracts that overlap your planned holding period. If a stock has sudden heavy activity in weekly options expiring before your short option, while implied volatility and stock volume are also expanding, the setup deserves a higher event-risk classification. The market may be signaling uncertainty that a standard earnings calendar will not capture.
Watch for asymmetry as well. Heavy demand for far out-of-the-money puts, a sharp increase in downside skew, or aggressive call activity at a specific strike can indicate where traders are paying for convexity. These are not instructions to follow the flow. They are reasons to ask what could force a discontinuous move and whether your position can survive it.
A practical volume check before selling premium
Use unusual volume as part of a short pre-trade review, not as a standalone screen. Start by comparing current volume with the stock's recent average and its normal intraday pace. A late-day surge is different from a stock that trades heavily from the opening bell.
Next, identify the explanation. Check whether earnings, a scheduled corporate event, an SEC filing, a legal matter, a regulatory decision, or sector news falls inside your option expiry window. A volume spike with a clear event date is usually a reason to measure the expected move more carefully. A spike with no clear explanation is a reason to reduce confidence, not invent a story.
Then inspect the option market. Look at near-term implied volatility relative to the stock's own history, expiration-specific volume, open interest, skew, and whether the expected move has expanded. High implied volatility can create attractive premium, but attractive premium is not the same as favorable compensation.
Finally, match the evidence to the structure. A covered call has different exposure from a cash-secured put, and a defined-risk credit spread has different exposure from an uncovered short option. Narrow spreads can still suffer sharp mark-to-market losses when the underlying gaps through a short strike. Wider spreads reduce some assignment and pin risk, but they also increase capital at risk. There is no universal adjustment.
For a trader selling cash-secured puts, the operational question may be simple: would you be comfortable owning the shares after a 10%, 15%, or 25% overnight decline? For a credit-spread seller, ask whether the credit received justifies the probability that a catalyst pushes the stock through both strikes before you can adjust. If the answer depends on a calm market staying calm, pass on the trade.
Common mistakes when reading unusual volume
The first mistake is treating volume as insider evidence. Unusual activity can come from informed participants, but it can just as easily come from funds, dealers, news-driven retail participation, or routine institutional execution. A disciplined process does not confuse a clue with proof.
The second is ignoring the base rate. Large-cap stocks frequently have high-volume days that lead nowhere. A volume signal becomes more valuable when it is unusual relative to that specific name and corroborated by a time-sensitive catalyst or options-market change.
The third is using volume to justify a trade you already want to place. Premium sellers are particularly vulnerable to this because rich options can look compelling precisely when the market is pricing meaningful uncertainty. If the evidence is mixed, smaller size, more time before entry, a wider distance from the short strike, or no trade at all may be the correct response.
The fourth is focusing on direction instead of discontinuity. You do not need to know whether a stock will gap up or down to recognize that a short-volatility position faces more risk. The relevant concern is whether the move could exceed the premium received and your position's planned loss threshold.
Build volume into an event-risk workflow
The most useful role for volume is triage. It helps you decide which tickers deserve deeper research before capital is committed. A market-wide scan can surface names with abnormal stock or options activity, but the decision should still be made at the ticker level and within the exact expiration window you plan to trade.
TickerRisk is built around that workflow: identify abnormal activity, place it beside known and emerging catalysts, then assess whether the short-option setup still makes sense for the selected expiry. That approach is more reliable than searching for one magic indicator because gap risk is rarely explained by one data point.
Unusual volume is not a prediction machine. It is a prompt to slow down when the market appears to be repricing uncertainty. When your strategy earns small, recurring credits while remaining exposed to occasional large moves, that prompt can be worth far more than another trade.
TickerRisk scores any S&P 500 ticker for earnings, FDA, legal & SEC catalysts in your expiry window — free, no login required.
Open the scanner